Choosing a wind turbine for your hybrid solar and wind system
Benefits of Combining Wind and Solar Energy
- You can have power when the sun is not shining.
- You can have power when the wind is not blowing.
- Your battery capacity will last longer.
- Your diesel generator will be operating less often.
- You can have high power both in winter and summer
- You can have high power both early morning and late afternoon
 Look
at the capture of solar energy over an entire year, showing the the
hour of the day that it is generated. There are always many hours a
day with low solar energy especially in the winter. Larger image.
Look
at the capture of solar energy over an entire year, showing the the
hour of the day that it is generated. There are always many hours a
day with low solar energy especially in the winter. Larger image.
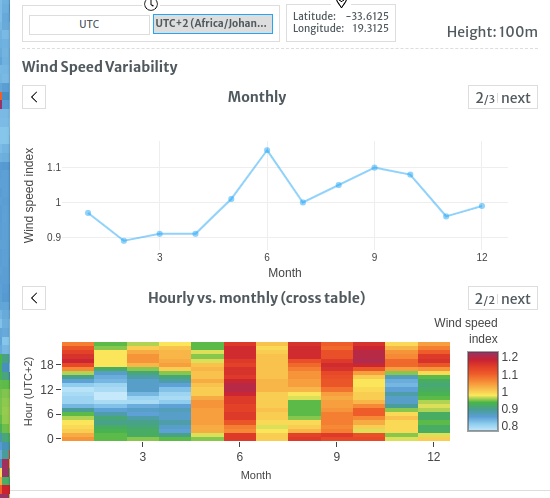 Now
see the capture of wind energy for an entire year at the same site,
showing the hour of the day that it is generated. Note that the wind
can blow in any hour in any month without much variation. It
certainly delivers power in winter evenings. Larger image.
Now
see the capture of wind energy for an entire year at the same site,
showing the hour of the day that it is generated. Note that the wind
can blow in any hour in any month without much variation. It
certainly delivers power in winter evenings. Larger image.
Wind energy and solar energy are both intermittent sources of power. Combined together they are much more reliable and consistent. [1]
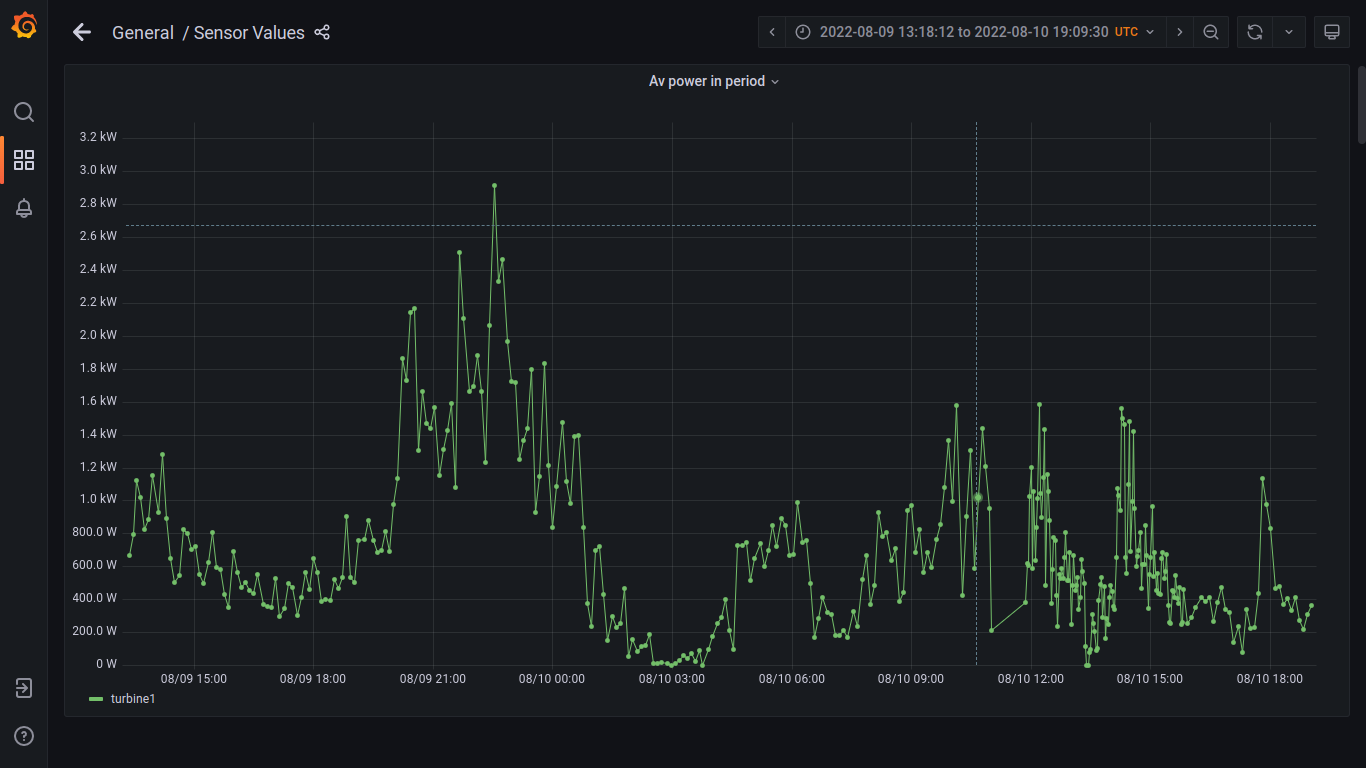 Our turbine generates non-stop for days even in light winds under
3m/s. Larger image.
Our turbine generates non-stop for days even in light winds under
3m/s. Larger image.
Wind Energy
Wind energy is the kinetic energy of air in motion, also called wind. The air must pass horizontally through the swept area A of your turbine rotor. The rotor must be facing the wind. Our vertical axis turbine is always facing the wind.
 The orange dashed line areas illustrate the swept areas for a horizontal
axis wind turbine (HAWT) and a vertical axis wind turbine
(VAWT).
The orange dashed line areas illustrate the swept areas for a horizontal
axis wind turbine (HAWT) and a vertical axis wind turbine
(VAWT).
The larger the area A, the larger the energy passing through area A.
Our 4kW turbine has A=27.5 square metres. This is the same area as a Horizontal Axis Turbine with a rotor diameter of 5.92 metres.
Total wind energy flowing through a reference surface with area A during the time t is:

Power is energy per unit time, so the wind power incident on A (e.g. equal to the rotor area of a wind turbine) is:

Any turbine with a smaller area A will harvest less energy over the year. The power rating of a turbine is irrelevant at common site windspeeds. Size matters! [4]
The proportion of the reference power P captured by a turbine is called the Power Coefficient or Cp. Even a perfect turbine is limited to a Cp = 0.593. This limit is known as the Betz Limit. This is due to some of the wind deciding to go around the turbine rather than through it.
A large HAWT may have a Cp =0.5. Our turbine has a Cp = 0.4.
The Cp is improved by many factors. Our turbine airfoil operates at a higher Reynolds number than other designs. This helps to provide continuous generation at low windspeeds.
The above formulas for power in the wind also depend on the cube of the wind speed v3. Here are some examples. The density of air is 1.2 Kg per cubic metre.
| Windspeed m/s | Power in wind (Watts) for 27.5 square metres | Max Power captured (Watts) at Cp=0.4 |
|---|---|---|
| 1 | 16.5 | 6.6 |
| 2 | 132 | 52.8 |
| 3 | 445.5 | 178.2 |
| 4 | 1056 | 422.4 |
| 5 | 2062.5 | 825 |
| 6 | 3564 | 1425.6 |
| 7 | 5659.5 | 2263.8 |
| 8 | 8448 | 3379.2 |
| 9 | 12028.5 | 4811.4 |
Calculating Annual Wind Energy for a site
There are web sites such as the globalwindatlas.info to show the wind power at your site. You can choose to show mean energy density in W/m2. You can choose the tower height of 10 metres. You can search for your site using latitude and longitude. You can read the value of a pixel by hovering the pointer over the pixel.
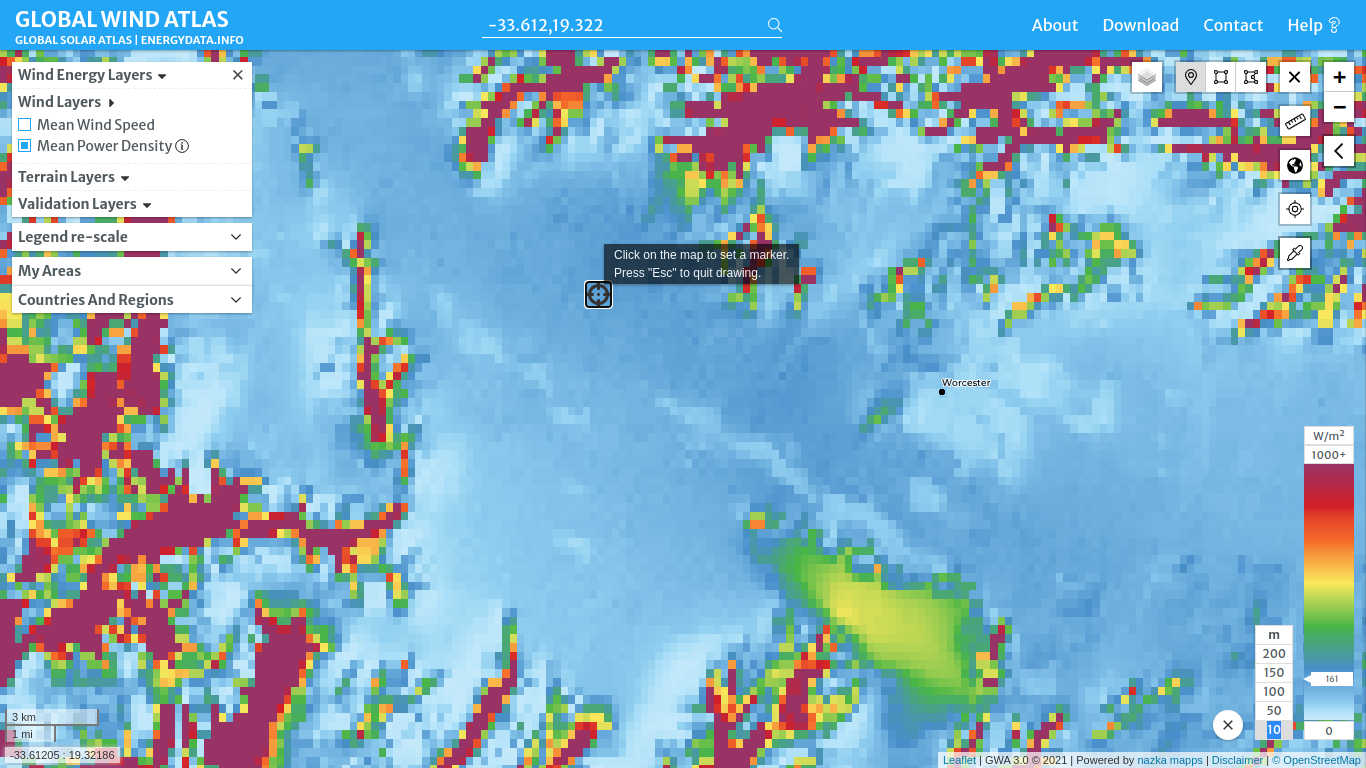 E.g. a site near Goudini in South Africa can be found searching for
"-33.612,19.322". The site has a mean annual wind power density of
162 W/m2. Larger image.
E.g. a site near Goudini in South Africa can be found searching for
"-33.612,19.322". The site has a mean annual wind power density of
162 W/m2. Larger image.
We can estimate an upper limit for the annual energy harvested by our turbine at that Goudini site as:
- Cp x WindPowerDensity x Area x hours/year
- = 0.4 x 162 x 27.5 x (24 x 365) = 15.6 MWh/year.
Of course this is a simple formula and is an upper limit. In reality
the turbine must limit the maximum power harvested to the rating of
its generator. This more complicated computation is done with a
spreadsheet available as turbinewindpower.xlsx.zip, or turbinewindpower.ods.zip,
or
as editable google doc (you will need to choose "Open with google
sheets" to edit the yellow cell C2 for your sites mean wind speed).
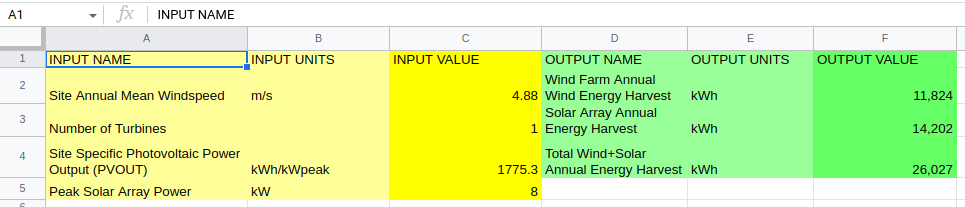 For all spreadsheets you can edit cell C2
for your sites mean wind speed. You will find the resulting
calculated annual wind energy harvest at green cell F2. The Goudini site has
exact annual energy harvest of 11.8 MWh/year with capacity
factor CF=0.34 at rated power of 4000W at 8.5m/s.
For all spreadsheets you can edit cell C2
for your sites mean wind speed. You will find the resulting
calculated annual wind energy harvest at green cell F2. The Goudini site has
exact annual energy harvest of 11.8 MWh/year with capacity
factor CF=0.34 at rated power of 4000W at 8.5m/s.
Example savings from wind power
Grid electricity is supplied by Eskom with a large number of tariffs.
I will choose a tariff where all charges are combined into the per unit price.
Eskom LANDLIGHT 60A tariff = 5.77 Rand/kWh (0.34 Euro/kWh).
The saving is 90,072 Rand or 5,326 Euro per year. In Europe, the consumer electricity prices are comparable to 0.34 Euro/kWh.
Diesel generators will generate 1 kWh at a fuel cost of 8.25 rand.
Future consumer electricity prices are set to rise due to needed transmission line investment and fossil fuel costs.
Solar Energy
Calculating Annual Solar Energy for a site
 The annual solar energy
available at the site is calculated using web sites such as globalsolaratlas.info.
The annual solar energy
available at the site is calculated using web sites such as globalsolaratlas.info.
You can search for your site using latitude and longitude.
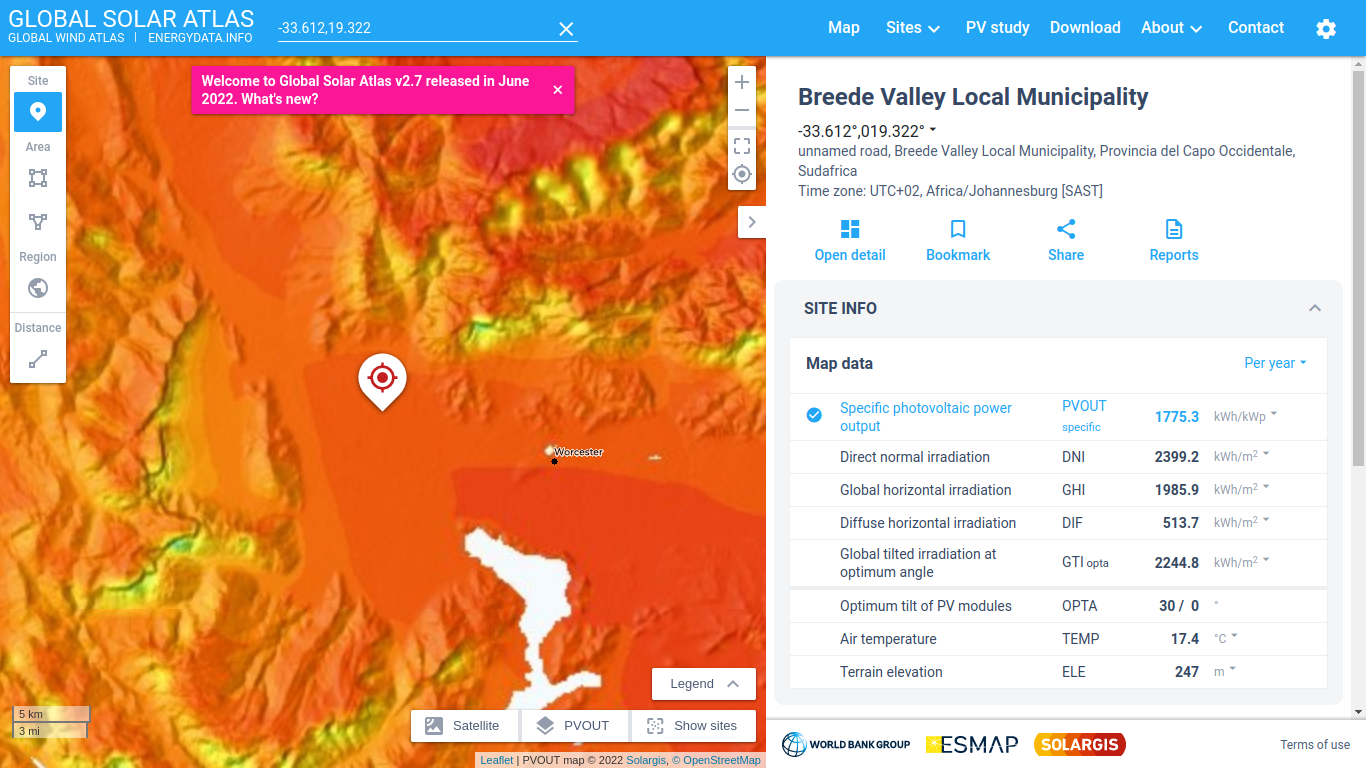
E.g. Searching for Goudini latitude and longitude results in the
following screen. Larger image.
Solar and wind energy complement each other by reducing the number
of hours per year when then is no generation.
We saw that
at the Goudini site we could generate up to 15.6 MWh/year from the
wind.
We choose to scale our solar array to generate that
same number of MWh/year.
The Goudini site has an annual Specific Photovoltaic Power Output (PVOUT) value of 1775.3 kWh/kWpeak.
PVOUT indicates how many kWh/year you can achieve for each kWpeak of solar panel max rated power.
The solar energy harvestable is also computable using the same spreadsheet available as turbinewindpower.xlsx.zip, or turbinewindpower.ods.zip, or as editable google doc (you will need to choose "Open with google sheets" to edit the yellow cell C4 for your sites PVOUT). For all spreadsheets you can edit cell C4 for your sites PVOUT. You will find the resulting calculated annual solar energy harvest at green cell F3. You can then try various sizes for your solar peak power rating by adjusting yellow cell C5 until you get a desired annual energy in F3.
We choose an 8 kWpeak solar system design to match our 4kW VAWT wind
turbine design.
This will generate up to 14 MWh/year from
solar.
Example savings from solar power
We sized our 8kW solar array to match our 4kW wind turbine annual
generation.
The savings will be equal.
We save
another 90,072 Rand or 5,326 Euro saving per year
Environmental Impact
The wind turbine has one moving part (the bearing), rated for at least 100 years lifetime, which is not expected to require any maintenance.
Wind turbines have a design tip speed ratio, which is the ratio of the speed of the turbine blade tip relative to the wind speed v. This ratio could be 8 for a typical HAWT.
The aerodynamic noise at our turbine's design tip speed is low. A small increase in tip speed dramatically increases noise. [3] As our tip speed is only 1/2 that of a typical HAWT we expect our aerodynamic noise to be 15db less than that of a HAWT.
The ground area for the guy lines is a square 7m x 7m so 49 square metres.
The matching suggested solar panel array with 8kW peak power will need 20 panels, each 2 square metres area so a minimum total of 40 square metres.
References
- ^ "How complimentary are wind and solar power?" (HTML). Abundance. . Retrieved 2014-04-09.
- ^ Jump up to: a b "Harvesting the Wind: The Physics of Wind Turbines" (PDF). Archived from the original (PDF) on 24 August 2015. Retrieved 10 May 2017 .
- ^ Vít Štorch (2016). "Measurement of noise and its correlation to performance and geometry of small aircraft propellers".
- ^ Sagrillo, Mick (2010). "SMALL TURBINE COLUMN" (PDF). Windletter. 29 (1). Archived from the original (PDF) on 26 April 2012. Retrieved 19 December 2011 .